Emerson Highlights Strategy for Engineering the Autonomous Future at 2025 Investor Conference
$18.0B
2025 Net Sales
8%
Of sales spent on innovation in 2025
~71K
Employees
136
Year history
As of Sept. 30, 2025 • 10-K 2025
For complete information regarding our financials, see our periodic filings.
Latest Financial Results
FY 2025
Fiscal Year Ended Sep 30, 2025
4%
Underlying Orders Growth
3%
Underlying Sales Growth
27.6%
Adjusted Segment EBITA Margin
$6.00
Adjusted Earnings Per Share
Source: Q4 2025 Earnings Press Release
Numbers above are Non-GAAP. See reconciliations in our latest press release.

Emerson Is an Innovation Leader Helping Customers Solve Their Most Complex Problems
Emerson has established itself as a trusted partner for industry leaders, with a leading global presence and comprehensive automation portfolio. We deliver every day by executing on our clear value creation framework through organic growth, continued operational excellence and capital allocation. The Emerson Management System supports our performance by keeping our teams laser focused on innovation and driving Emerson forward.
Financial Performance
Sales by Geography
2025
As of Sept. 30, 2025 • 10-K 2025
Net Sales
In Millions
| Year | Revenue | Underlying Sales Growth* |
|---|---|---|
| 2021 | $12,392.00 | -- |
| 2022 | $13,804.00 | $7.00 |
| 2023 | $15,165.00 | $10.00 |
| 2024 | $17,492.00 | $6.00 |
| 2025 | $18,016.00 | $3.00 |
As of Sept. 30, 2025 • 10-K 2025
Adjusted Diluted EPS*
| Year | Adjusted Earnings Per Share* |
|---|---|
| 2021 | $3.01 |
| 2022 | $3.64 |
| 2023 | $4.44 |
| 2024 | $5.49 |
| 2025 | $6.00 |
As of Sept. 30, 2025 • 10-K 2025
Note: Data shown is on a continuing operations basis.
*Underlying Sales Growth and Adjusted EPS are Non-GAAP measures. View full reconciliation for 2021, 2022, and 2023 in our
2023 Annual Report. View full reconciliation for 2024 and 2025 in our 2025 10-K.
For complete information regarding our financials, see our periodic filings.
Latest Annual Filing
For Fiscal Year Ending Sep 30, 2025
Emerson Is Built for Value Creation
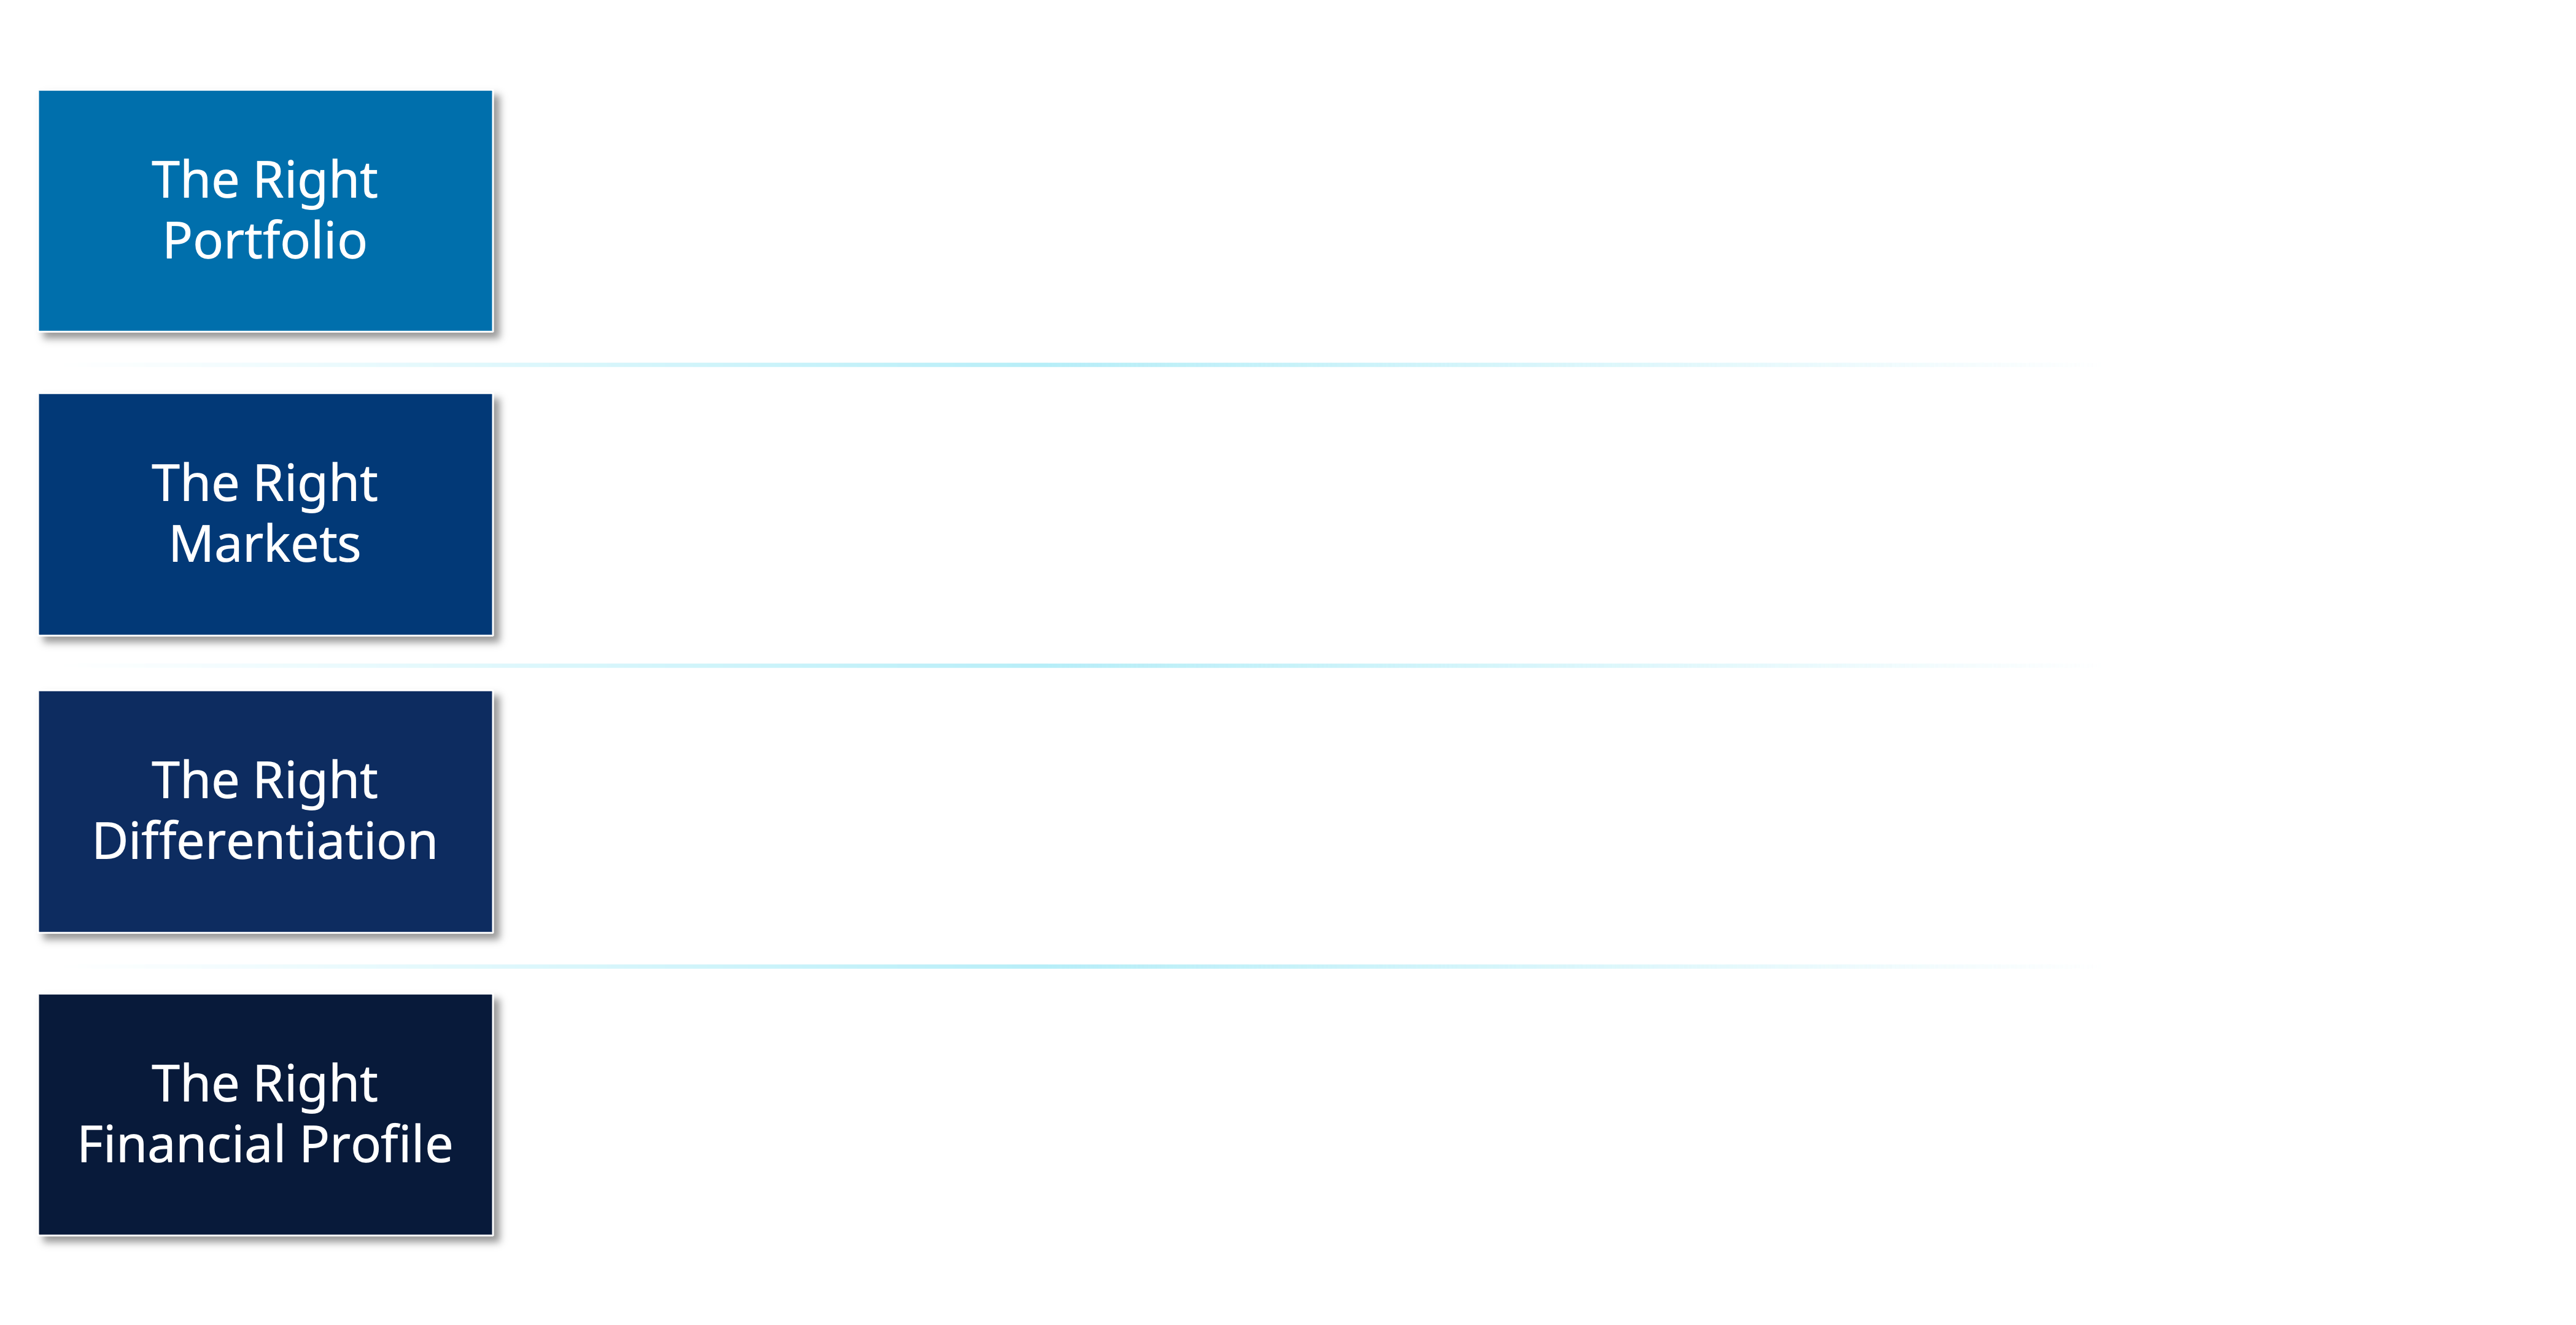 Description of Built for Value Creation
Emerson is built for value creation, with the right portfolio as a global automation leader. Emerson serves the right markets, having broad market exposure and a broad mix of customers, and Emerson expects to see accelerated growth from key verticals.
Emerson has the right differentiation, with an unparalleled software-defined technology stack. These all culminate in Emerson having the right financial profile: compelling growth algorithm, cash generation and value creation.
Emerson has the right differentiation, with an unparalleled software-defined technology stack. These all culminate in Emerson having the right financial profile: compelling growth algorithm, cash generation and value creation.
Emerson’s Value Creation Framework
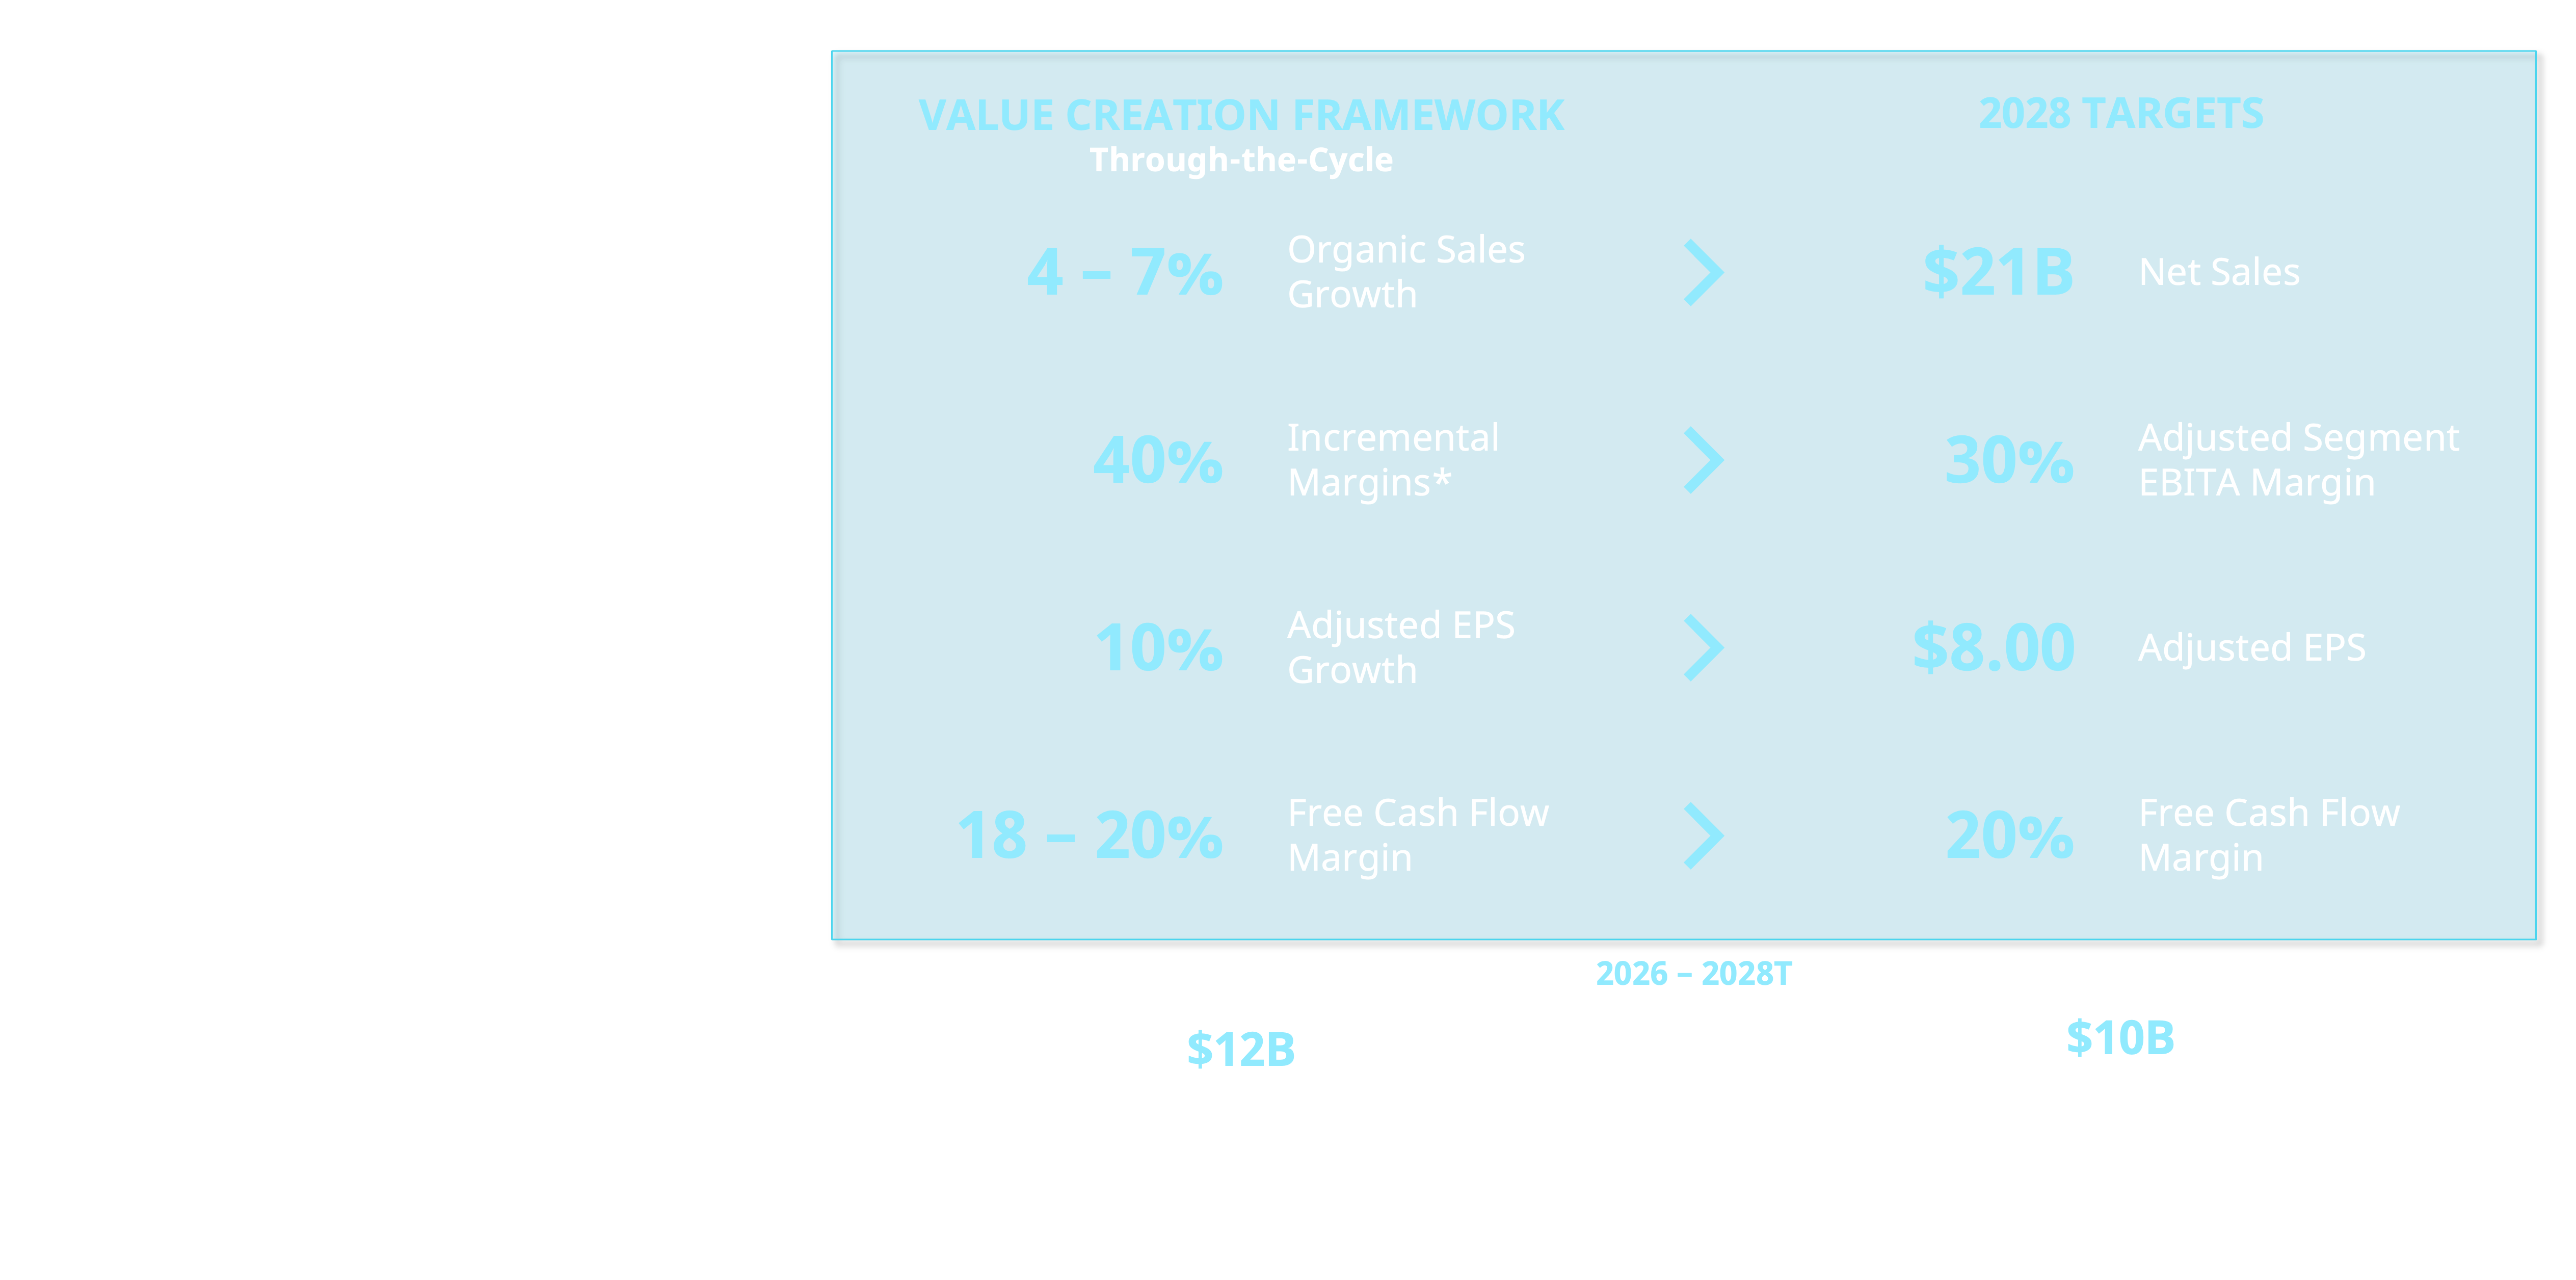 Description of Value Creation Framework
Emerson plans to deliver its value creation framework through organic growth, continued operational excellence and capital allocation. Emerson’s through-the-cycle value creation framework consists of 4-7% organic sales growth, 40% incremental margins, 10% adjusted earnings per share growth and 18-20% free cash flow margin.
Emerson’s 2028 financial targets are $21 billion net sales, 30% adjusted segment EBITA margin (2.4 percentage points of margin expansion), $8.00 adjusted earnings per share and 20% free cash flow margin. Emerson’s financial targets also include generating $12 billion in cumulative free cash flow from 2026 to 2028 and cash returns of $10 billion through $6 billion share repurchase and $4 billion dividends.
IR Contacts
Emerson Global Headquarters
Emerson
8027 Forsyth Boulevard
St. Louis, MO 63105
T: 314-553-2000
Investor Relations
Emerson
Doug Ashby
Director – Investor Relations
T: 314-553-2197
investor.relations@emerson.com
Transfer Agent
Computershare
Attention: Emerson Electric Co.
P.O. Box 43006
Providence, RI 02940-3006
T: 888-213-0970